# Backtest VaR: Đánh giá mô hình quản trị rủi ro


Trong quản trị rủi ro tài chính, **Value at Risk (VaR)** là một con số ước lượng mức tổn thất tối đa có thể xảy ra trong một khoảng thời gian nhất định, với một độ tin cậy cho trước. Tuy nhiên, làm sao để biết mô hình VaR mà ngân hàng đang sử dụng có thực sự chính xác hay không? Đây là lúc quá trình **Backtesting** (kiểm định ngược) và đặc biệt là **Kiểm định Kupiec POF (Proportion of Failures)** phát huy tác dụng.

> [!NOTE]
> **Bối cảnh dữ liệu minh họa trong bài:**
> Các ví dụ và con số backtest trong bài viết này được trích xuất trực tiếp từ đồ án đánh giá rủi ro danh mục mô phỏng (gồm 3 mã cổ phiếu **FPT, VNM, VCB** với tỷ trọng phân bổ **40% - 30% - 30%**).
> - **Tổng thể dữ liệu:** Kéo dài hơn 14 năm, từ ngày 20/03/2012 đến 30/06/2026.
> - **Giai đoạn Backtest (Ngoài mẫu):** Quá trình dự báo và đếm số ngày thất bại được thực hiện trên tập dữ liệu ngoài mẫu từ **02/01/2025 đến 30/06/2026** (chính xác **368 ngày giao dịch**). Thuật toán Backtest được thực hiện bằng phương pháp **Cửa sổ trượt (Rolling Window)** cực kỳ nghiêm ngặt để tránh rò rỉ dữ liệu.

<div class="interactive-pane">
  <div class="context-card" style="background: linear-gradient(135deg, #ffffff 0%, #f8f9fa 100%); border-radius: 12px; padding: 24px; box-shadow: 0 4px 15px rgba(0,0,0,0.05); border-left: 4px solid #3498db; margin-bottom: 24px; border: 1px solid #e9ecef; border-left-width: 4px;">
    <h3 style="margin-top: 0; color: #2c3e50; font-size: 1.2rem; display: flex; align-items: center; gap: 8px; font-weight: 600; margin-bottom: 12px;">
      <svg width="22" height="22" viewBox="0 0 24 24" fill="none" stroke="#3498db" stroke-width="2.5" stroke-linecap="round" stroke-linejoin="round"><circle cx="12" cy="12" r="10"></circle><line x1="12" y1="16" x2="12" y2="12"></line><line x1="12" y1="8" x2="12.01" y2="8"></line></svg>
      Bối cảnh dữ liệu minh họa
    </h3>
    <p style="font-size: 0.95rem; color: #555; margin-bottom: 16px; line-height: 1.5;">
      Bài viết sử dụng ví dụ từ đồ án đánh giá rủi ro danh mục mô phỏng với tỷ trọng phân bổ:
    </p>
    <div style="display: flex; gap: 20px; align-items: stretch; margin-bottom: 8px;">
      <div style="display: flex; flex-direction: column; align-items: center; justify-content: center; background: #fff; padding: 16px; border-radius: 8px; box-shadow: 0 2px 6px rgba(0,0,0,0.04); border: 1px solid #f1f3f5;">
        <div style="position: relative; width: 130px; height: 130px; border-radius: 50%; background: conic-gradient(#e74c3c 0% 40%, #2ecc71 40% 70%, #3498db 70% 100%); box-shadow: 0 4px 10px rgba(0,0,0,0.1); border: 2px solid white;">
          <div style="position: absolute; top: 25%; right: 10%; text-align: center; color: white; text-shadow: 0 1px 3px rgba(0,0,0,0.4);">
            <div style="font-weight: 800; font-size: 0.85rem; line-height: 1.2;">FPT</div>
            <div style="font-weight: 600; font-size: 0.75rem;">40%</div>
          </div>
          <div style="position: absolute; bottom: 12%; left: 35%; text-align: center; color: white; text-shadow: 0 1px 3px rgba(0,0,0,0.4);">
            <div style="font-weight: 800; font-size: 0.85rem; line-height: 1.2;">VNM</div>
            <div style="font-weight: 600; font-size: 0.75rem;">30%</div>
          </div>
          <div style="position: absolute; top: 25%; left: 10%; text-align: center; color: white; text-shadow: 0 1px 3px rgba(0,0,0,0.4);">
            <div style="font-weight: 800; font-size: 0.85rem; line-height: 1.2;">VCB</div>
            <div style="font-weight: 600; font-size: 0.75rem;">30%</div>
          </div>
        </div>
      </div>
      <div style="flex: 1; display: flex; flex-direction: column; justify-content: center; padding: 20px 15px 10px; background: rgba(52, 152, 219, 0.02); border-radius: 8px; border: 1px solid #f1f3f5;">
        <div style="font-weight: 700; font-size: 0.95rem; color: #2c3e50; margin-bottom: 50px; text-align: center;">Dữ liệu: >14 năm</div>
        <div style="position: relative; width: 90%; margin: 0 auto 30px; height: 6px; background: #ecf0f1; border-radius: 3px;">
          <!-- Toàn bộ lịch sử (Background xanh nhạt) -->
          <div style="position: absolute; top: 0; left: 0; right: 0; height: 100%; background: rgba(52, 152, 219, 0.3); border-radius: 3px;"></div>
          <!-- Cửa sổ trượt (Màu vàng cam) -->
          <div style="position: absolute; top: 0; left: 30%; right: 40%; height: 100%; background: #f39c12; border-radius: 3px;"></div>
          <!-- Backtest ngoài mẫu (Màu đỏ) -->
          <div style="position: absolute; top: 0; left: 60%; right: 0; height: 100%; background: #e74c3c; border-radius: 3px;"></div>
          <!-- Các điểm mốc (Nodes) -->
          <!-- Ngày đầu tiên -->
          <div style="position: absolute; top: -5px; left: 0; width: 16px; height: 16px; background: #3498db; border: 3px solid #fff; border-radius: 50%; transform: translateX(-50%); box-shadow: 0 1px 3px rgba(0,0,0,0.2);"></div>
          <div style="position: absolute; top: 16px; left: 0; transform: translateX(-15%); font-size: 0.75rem; color: #7f8c8d; white-space: nowrap; font-weight: 600;">20/03/2012</div>
          <!-- Bắt đầu Backtest -->
          <div style="position: absolute; top: -5px; left: 60%; width: 16px; height: 16px; background: #e74c3c; border: 3px solid #fff; border-radius: 50%; transform: translateX(-50%); box-shadow: 0 1px 3px rgba(0,0,0,0.2);"></div>
          <div style="position: absolute; top: 16px; left: 60%; transform: translateX(-50%); font-size: 0.75rem; color: #7f8c8d; white-space: nowrap; font-weight: 600;">02/01/2025</div>
          <!-- Kết thúc -->
          <div style="position: absolute; top: -5px; right: 0; width: 16px; height: 16px; background: #2ecc71; border: 3px solid #fff; border-radius: 50%; transform: translateX(50%); box-shadow: 0 1px 3px rgba(0,0,0,0.2);"></div>
          <div style="position: absolute; top: 16px; right: 0; transform: translateX(15%); font-size: 0.75rem; color: #7f8c8d; white-space: nowrap; font-weight: 600;">30/06/2026</div>
          <!-- Underbrace Cửa sổ trượt -->
          <div style="position: absolute; top: -30px; left: 30%; right: 40%; text-align: center;">
            <div style="border-top: 1.5px solid #f39c12; border-left: 1.5px solid #f39c12; border-right: 1.5px solid #f39c12; height: 6px; border-radius: 4px 4px 0 0; margin-bottom: 4px;"></div>
            <div style="position: absolute; top: -18px; left: 50%; transform: translateX(-50%); font-size: 0.75rem; color: #d35400; font-weight: 700; white-space: nowrap;">Cửa sổ 500 ngày</div>
          </div>
          <!-- Underbrace Backtest -->
          <div style="position: absolute; top: -30px; left: 60%; right: 0; text-align: center;">
            <div style="border-top: 1.5px solid #e74c3c; border-left: 1.5px solid #e74c3c; border-right: 1.5px solid #e74c3c; height: 6px; border-radius: 4px 4px 0 0; margin-bottom: 4px;"></div>
            <div style="position: absolute; top: -18px; left: 50%; transform: translateX(-50%); font-size: 0.75rem; color: #c0392b; font-weight: 700; white-space: nowrap;">Backtest 368 ngày</div>
          </div>
        </div>
      </div>
    </div>
  </div>
</div>

<style>
  .rw-container {
    width: 100%; overflow: hidden; background: #f8f9fa; border-radius: 8px; padding: 20px; box-shadow: 0 4px 12px rgba(0,0,0,0.05); margin: 30px 0; border: 1px solid #e9ecef;
  }
  .rw-header { font-weight: 600; margin-bottom: 15px; font-size: 1.1em; color: #2c3e50; text-align: center; }
  .rw-grid { display: flex; flex-wrap: nowrap; gap: 4px; overflow-x: auto; padding-bottom: 10px; margin-bottom: 15px; }
  .rw-cell {
    min-width: 32px; height: 32px; display: flex; align-items: center; justify-content: center; font-size: 0.8em; font-weight: bold; border-radius: 4px; transition: all 0.3s ease; border: 1px solid #ccc; background: #fff;
  }
  .rw-col { display: flex; flex-direction: column; align-items: center; gap: 8px; margin-top: 5px; }
  .rw-actual { font-size: 0.7em; color: #2c3e50; font-weight: bold; line-height: 1; }
  .rw-predicted { font-size: 0.7em; color: #e67e22; font-weight: bold; line-height: 1; min-height: 10px; }
  .flash-compare { animation: flashText 0.4s infinite alternate; color: #c0392b !important; }
  @keyframes flashText { 0% { transform: scale(1); filter: brightness(1); } 100% { transform: scale(1.4); filter: brightness(1.5); } }
  .rw-window { background: #3498db; color: #fff; border-color: #2980b9; transform: scale(1.1); z-index: 2; box-shadow: 0 2px 4px rgba(52, 152, 219, 0.4); }
  .rw-target { background: transparent; color: #e67e22; border: 2px dashed #e67e22; animation: pulseTarget 1s infinite alternate; }
  .rw-past { background: #bdc3c7; color: #7f8c8d; border-color: #95a5a6; opacity: 0.5; }
  .rw-future { background: #ecf0f1; color: #95a5a6; }
  .rw-evaluated.safe { background: #2ecc71; color: #fff; border-color: #27ae60; animation: none; transform: scale(1); border-style: solid; }
  .rw-evaluated.fail { background: #c0392b; color: #fff; border-color: #900; animation: none; transform: scale(1); border-style: solid; }
  @keyframes pulseTarget { 0% { box-shadow: 0 0 0 rgba(230, 126, 34, 0); } 100% { box-shadow: 0 0 8px rgba(230, 126, 34, 0.8); } }
  .rw-msg { text-align: center; font-size: 0.95em; color: #34495e; min-height: 48px; }
  .rw-legend { display: flex; justify-content: center; gap: 20px; font-size: 0.85em; margin-top: 10px; color: #7f8c8d; }
  .rw-legend-item { display: flex; align-items: center; gap: 6px; }
  .rw-box { width: 14px; height: 14px; border-radius: 3px; }
  .rw-controls { display: flex; justify-content: center; gap: 15px; margin-top: 15px; }
  .rw-btn { padding: 8px 16px; border: none; border-radius: 20px; font-weight: bold; cursor: pointer; transition: all 0.2s; font-size: 0.85em; }
  .rw-btn-auto { background: #ecf0f1; color: #2c3e50; border: 2px solid #bdc3c7; }
  .rw-btn-auto.active { background: #3498db; color: white; border-color: #2980b9; box-shadow: 0 0 8px rgba(52, 152, 219, 0.4); }
  .rw-btn-step { background: #ecf0f1; color: #2c3e50; border: 2px solid #bdc3c7; }
  .rw-btn-step:hover { background: #e0e6ed; }
  .rw-btn-step.active { background: #e74c3c; color: white; border-color: #c0392b; box-shadow: 0 0 8px rgba(231, 76, 60, 0.4); }
  .rw-log-wrapper { margin: 25px 0 10px; border-top: 1px dashed #bdc3c7; padding-top: 15px; }
  .rw-log-header { font-size: 0.9em; font-weight: bold; color: #34495e; margin-bottom: 10px; text-align: center; }
  .rw-log-grid { display: flex; justify-content: center; gap: 4px; padding-bottom: 5px; }
  .rw-log-cell { width: 14px; height: 14px; border-radius: 3px; background: #ecf0f1; transition: background 0.3s; flex-shrink: 0; border: 1px solid #ccc; }
  .rw-log-cell.safe { background: #2ecc71; border-color: #27ae60; box-shadow: 0 0 4px rgba(46,204,113,0.4); }
  .rw-log-cell.fail { background: #c0392b; border-color: #900; box-shadow: 0 0 6px rgba(192,57,43,0.6); }
  .rw-diagram-loop { position: relative; width: 100%; max-width: 420px; height: 160px; margin: 30px auto; font-size: 0.85em; z-index: 1; }
  .rw-step { position: absolute; padding: 6px 10px; border-radius: 20px; background: #ecf0f1; border: 2px solid #bdc3c7; color: #7f8c8d; transition: all 0.3s; font-weight: bold; text-align: center; z-index: 2; box-shadow: 0 2px 4px rgba(0,0,0,0.05); }
  .rw-step.active { background: #fff8e1; border-color: #f39c12; color: #d35400; box-shadow: 0 0 10px rgba(243, 156, 18, 0.4); transform: scale(1.05); z-index: 3; }
  
  .pof-flowchart-wrapper { width: 100%; overflow-x: auto; margin: 30px 0; }
  .pof-flowchart { display: flex; flex-direction: column; align-items: center; min-width: 500px; font-family: -apple-system, BlinkMacSystemFont, "Segoe UI", Roboto, sans-serif; text-align: center; }
  .pof-node { background: #e3f2fd; border: 2px solid #1976d2; padding: 12px 20px; border-radius: 4px; font-weight: bold; color: #0d47a1; box-shadow: 0 4px 6px rgba(0,0,0,0.05); line-height: 1.4; font-size: 0.9em; position: relative; z-index: 2; }
  .pof-node.safe { background: #e8f5e9; border-color: #2e7d32; color: #1b5e20; }
  .pof-node.fail { background: #ffebee; border-color: #c62828; color: #b71c1c; }
  .pof-branch-label { font-size: 0.85em; font-weight: bold; color: #7f8c8d; background: white; padding: 4px 12px; border: 1px solid #bdc3c7; border-radius: 12px; margin-bottom: -10px; position: relative; z-index: 2; box-shadow: 0 2px 4px rgba(0,0,0,0.05); }
  
</style>

## 1. Logic của quá trình Backtesting VaR

Nếu bạn thiết lập VaR ở độ tin cậy 95% cho 100 ngày giao dịch, bạn kỳ vọng sẽ có khoảng 5 ngày (5%) mà mức lỗ thực tế vượt quá ngưỡng dự báo của VaR. Những ngày vượt ngưỡng này được gọi là các **ngoại lệ (exceptions)** hay **thất bại (failures)**.

Để kiểm chứng độ chính xác (Out-of-sample backtesting), chúng ta sử dụng cơ chế **Cửa sổ trượt (Rolling Window)**. Lấy ví dụ với bộ dữ liệu 868 ngày, ta dùng cửa sổ 500 ngày (tương đương ~2 năm giao dịch):

1. **Khởi tạo:** Để dự báo VaR cho ngày $t$, mô hình chỉ được phép nhìn vào 500 ngày giao dịch ngay trước đó (từ ngày $t-500$ đến $t-1$).
2. **Ước lượng tham số (MLE):** Thuật toán tự động chạy Maximum Likelihood Estimation để tìm ra các tham số phân phối (ví dụ: $\mu, \sigma, \nu$) mới tinh, chỉ dựa trên 500 ngày này.
3. **Dự báo:** Dựa trên các tham số vừa học được, mô hình tính ra một ngưỡng VaR dự báo cho ngày $t$.
4. **Đối chiếu (Test P&L):** Cuối cùng, mô hình mở "đáp án" của ngày $t$ ra xem mức lỗ thực tế có đâm thủng VaR dự báo hay không (nếu đâm thủng, ghi nhận 1 thất bại).
5. **Trượt cửa sổ (+1):** Sang ngày $t+1$, cửa sổ lại trượt đi 1 bước: vứt bỏ ngày cũ nhất ở đuôi ($t-500$) và nạp thêm ngày $t$ vào đầu để tiếp tục dự báo cho $t+1$. Quá trình lặp lại vòng lặp này cho đến hết 368 ngày test.

Bạn có thể tự tay chạy mô phỏng quá trình này (phiên bản thu nhỏ 20 ngày) thông qua UI tương tác dưới đây để hiểu tường tận cơ chế trước khi đi sâu vào Toán học:

<div class="interactive-pane">

<div class="rw-container">
  <div class="rw-header">Minh hoạ Backtest "Cửa sổ trượt" (Rolling Window)</div>
  <div class="rw-grid" id="rolling-window-grid"></div>
  <div class="rw-msg" id="rolling-window-msg">Đang nạp dữ liệu...</div>
  <div class="rw-diagram-loop">
    <svg style="position: absolute; top:0; left:0; width:100%; height:100%; z-index:0;" viewBox="0 0 420 160">
      <defs>
        <marker id="arr" viewBox="0 0 10 10" refX="7" refY="5" markerWidth="6" markerHeight="6" orient="auto">
          <path d="M 0 0 L 10 5 L 0 10 z" fill="#3498db" />
        </marker>
      </defs>
      <!-- 1 -> 2 (Khởi tạo -> MLE) -->
      <path d="M 85 30 L 130 30" stroke="#3498db" stroke-width="2" stroke-dasharray="4,4" marker-end="url(#arr)" />
      <!-- 2 -> 3 (MLE -> Test) -->
      <path d="M 290 30 Q 360 30 360 70 Q 360 110 320 115" fill="none" stroke="#3498db" stroke-width="2" stroke-dasharray="4,4" marker-end="url(#arr)" />
      <!-- 3 -> 4 (Test -> Trượt) -->
      <path d="M 250 130 L 195 130" stroke="#3498db" stroke-width="2" stroke-dasharray="4,4" marker-end="url(#arr)" />
      <!-- 4 -> 2 (Trượt -> MLE) -->
      <path d="M 130 115 Q 130 70 160 50" fill="none" stroke="#3498db" stroke-width="2" stroke-dasharray="4,4" marker-end="url(#arr)" />
    </svg>
    <div class="rw-step" id="rw-step-1" style="top: 13px; left: 0px; width: 85px;">1. Khởi tạo</div>
    <div class="rw-step" id="rw-step-2" style="top: 13px; left: 140px; width: 150px;">2. Chạy MLE & Dự báo</div>
    <div class="rw-step" id="rw-step-3" style="top: 113px; left: 250px; width: 100px;">3. Test P&L</div>
    <div class="rw-step" id="rw-step-4" style="top: 113px; left: 80px; width: 100px;">4. Trượt (+1)</div>
  </div>
  <div class="rw-legend">
    <div class="rw-legend-item"><div class="rw-box" style="background:#bdc3c7"></div> Quá khứ</div>
    <div class="rw-legend-item"><div class="rw-box" style="background:#3498db"></div> Cửa sổ ước lượng (7 ngày)</div>
    <div class="rw-legend-item"><div class="rw-box" style="background:transparent; border: 2px dashed #e67e22; box-sizing: border-box;"></div> Ngày dự báo (t)</div>
    <div class="rw-legend-item"><div class="rw-box" style="background:#2ecc71"></div> Safe</div>
    <div class="rw-legend-item"><div class="rw-box" style="background:#c0392b"></div> Fail (Lỗ > VaR)</div>
  </div>
  <div class="rw-log-wrapper">
    <div class="rw-log-header">Lịch sử Đánh giá (Kết quả Backtest)</div>
    <div style="display: flex; justify-content: center; align-items: center;">
      <div id="rolling-window-log" class="rw-log-grid" style="padding-bottom: 0;"></div>
      <div id="rw-pof-result" style="opacity: 0; margin-left: 15px; font-weight: bold; color: #c0392b; font-size: 0.9em; transition: opacity 0.5s; white-space: nowrap;">POF: 3/13 (23%)</div>
    </div>
  </div>
  <div class="rw-controls">
    <button class="rw-btn rw-btn-auto active" id="rw-btn-auto">▶ Tự động (Auto Play)</button>
    <button class="rw-btn rw-btn-step" id="rw-btn-step">⏭ Chạy từng bước (Next Step)</button>
  </div>
</div>
<script src="/js/rolling-window-animation.js"></script>

</div>

## 2. Kiểm định Kupiec POF là gì?

Kiểm định Tỷ lệ thất bại của Kupiec (1995) thực chất là một ứng dụng trực tiếp của **[Kiểm định tỷ số hợp lý (Likelihood Ratio Test for Proportions)](/posts/math/stats/likelihood-ratio-proportion-test/)**. 

Trong ngữ cảnh của VaR:
- **Giả thiết null ($H_0$):** Xác suất xảy ra một thất bại ($p$) đúng bằng xác suất kỳ vọng của mô hình ($p_0 = 1 - c$, với $c$ là độ tin cậy của VaR).
- Dựa trên dữ liệu thực tế gồm $N$ ngày quan sát và $x$ ngày thất bại, ta tính được tỷ lệ thất bại thực tế $\hat{p} = \frac{x}{N}$.

Kupiec sử dụng thống kê tỷ số hợp lý (Likelihood Ratio - LR) để kiểm tra mức độ khác biệt giữa $\hat{p}$ và $p_0$. Chi tiết về cách thiết lập hàm hợp lý và công thức $LR$ tổng quát, bạn có thể xem thêm tại bài viết **[Kiểm định Tỷ lệ bằng Likelihood Ratio](/posts/math/stats/likelihood-ratio-proportion-test/)**.

Dưới giả thiết $H_0$, thống kê $LR_{POF}$ tuân theo phân phối Chi-bình phương với 1 bậc tự do ($\chi^2_1$). Nếu $LR_{POF}$ lớn hơn giá trị tới hạn (ví dụ $3.841$ ở mức ý nghĩa $5\%$), ta bác bỏ $H_0$, kết luận mô hình VaR dự báo sai. Sự sai lệch này có thể đến từ việc mô hình đánh giá quá thấp rủi ro (quá nhiều thất bại) hoặc đánh giá quá cao rủi ro (quá ít thất bại).

<div class="interactive-pane">
<div class="pof-flowchart-wrapper" style="margin: 0;">
  <div class="pof-flowchart" style="min-width: unset; width: 100%;">
    <div class="pof-node">Tổng hợp kết quả Backtest:<br>x ngày Fail trên tổng N ngày</div>
    <svg width="40" height="30" viewBox="0 0 40 30"><path d="M 20 0 L 20 25" stroke="#7f8c8d" stroke-width="2" fill="none"/><polygon points="15,22 25,22 20,28" fill="#7f8c8d"/></svg>
    <div class="pof-node">Tính thống kê Likelihood Ratio (LR)<br>theo công thức Kupiec POF</div>
    <svg width="40" height="30" viewBox="0 0 40 30"><path d="M 20 0 L 20 25" stroke="#7f8c8d" stroke-width="2" fill="none"/><polygon points="15,22 25,22 20,28" fill="#7f8c8d"/></svg>
    <div style="position: relative; width: 280px; height: 120px; display: flex; align-items: center; justify-content: center; margin: 10px 0;">
      <svg style="position: absolute; top: 0; left: 0; width: 100%; height: 100%; z-index: 1;" viewBox="0 0 280 120" preserveAspectRatio="none">
        <polygon points="140,2 278,60 140,118 2,60" fill="#fff3e0" stroke="#e65100" stroke-width="3" stroke-linejoin="round"/>
      </svg>
      <div style="color: #e65100; font-weight: bold; font-size: 0.95em; z-index: 2; padding: 0 40px; text-align: center; line-height: 1.3;">
        LR > Giá trị tới hạn<br>($\chi^2_1$) ?
      </div>
    </div>
    <svg width="100%" height="40" viewBox="0 0 480 40" preserveAspectRatio="xMidYMin slice" style="max-width: 480px;">
      <path d="M 240 0 L 240 20 L 110 20 L 110 35" stroke="#7f8c8d" stroke-width="2" fill="none"/>
      <polygon points="105,32 115,32 110,38" fill="#7f8c8d"/>
      <path d="M 240 20 L 370 20 L 370 35" stroke="#7f8c8d" stroke-width="2" fill="none"/>
      <polygon points="365,32 375,32 370,38" fill="#7f8c8d"/>
    </svg>
    <div style="display: flex; justify-content: space-between; gap: 10px; width: 100%; max-width: 480px;">
      <div style="display: flex; flex-direction: column; align-items: center; width: 48%;">
        <div class="pof-branch-label">No (LR ≤ Tới hạn)</div>
        <div class="pof-node safe" style="width: 100%; box-sizing: border-box;">Mô hình VaR đáng tin cậy<br>(Không bác bỏ $H_0$)</div>
      </div>
      <div style="display: flex; flex-direction: column; align-items: center; width: 48%;">
        <div class="pof-branch-label">Yes (LR > Tới hạn)</div>
        <div class="pof-node fail" style="width: 100%; box-sizing: border-box;">Mô hình VaR bị lỗi<br>(Bác bỏ $H_0$)</div>
      </div>
    </div>
  </div>
</div>
</div>

## 3. Trực quan hóa Bài toán POF trên Danh mục FPT-VNM-VCB

Giả sử ta thực hiện backtest mô hình VaR 95\% ($p_0 = 5\%$) trên tập dữ liệu ngoài mẫu gồm $N = 368$ ngày (tương ứng với giai đoạn 2025-2026 trong nghiên cứu). Mức vượt ngưỡng kỳ vọng là khoảng $18.4$ ngày. Dưới đây là kết quả của 3 mô hình giả định phân phối khác nhau:

- **Phân phối Chuẩn (Normal):** Ghi nhận 27 ngày vượt ngưỡng.
- **Phân phối Student-t:** Ghi nhận 34 ngày vượt ngưỡng.
- **Phân phối Laplace:** Ghi nhận 26 ngày vượt ngưỡng.

<div class="interactive-pane">
<div id="kupiec-animation-container" style="position: relative; width: 100%; min-height: 520px; background: #fff; border: 1px solid #ddd; border-radius: 8px; overflow: hidden; font-family: sans-serif; box-shadow: 0 4px 10px rgba(0,0,0,0.05); padding: 15px; box-sizing: border-box;">
   <div id="kupiec-formula" style="width: 100%; text-align: center; font-size: 1.1rem; font-weight: bold; color: #333; height: 30px;">Mô phỏng Backtest 368 ngày (VaR 95%, Kỳ vọng ~18.4 thất bại)</div>
   
   <div id="kupiec-grid" style="display: flex; flex-wrap: wrap; gap: 3px; justify-content: center; margin-top: 15px; align-content: flex-start; height: 180px; overflow: hidden;">
       <!-- 368 ô vuông đại diện cho 368 ngày sẽ được generate qua JS -->
   </div>
   
   <div id="kupiec-result" style="margin-top: 25px; min-height: 120px; background: #f9f9f9; border-radius: 6px; padding: 15px; text-align: center; font-size: 1rem; opacity: 0; transition: opacity 0.5s;">
      <!-- Nơi hiển thị công thức và kết quả LR -->
   </div>

   <div id="kupiec-controls" style="position: absolute; bottom: 15px; left: 50%; transform: translateX(-50%); display: flex; gap: 8px; width: 100%; justify-content: center; padding: 0 10px; box-sizing: border-box; flex-wrap: wrap;">
      <button onclick="simKupiec(26, 'Laplace')" style="padding: 8px 12px; cursor: pointer; border: none; background: #2ca02c; color: white; border-radius: 4px; font-weight: bold; flex: 1; min-width: 120px; max-width: 180px;">Laplace (x=26)</button>
      <button onclick="simKupiec(27, 'Normal')" style="padding: 8px 12px; cursor: pointer; border: none; background: #ff7f0e; color: white; border-radius: 4px; font-weight: bold; flex: 1; min-width: 120px; max-width: 180px;">Normal (x=27)</button>
      <button onclick="simKupiec(34, 'Student-t')" style="padding: 8px 12px; cursor: pointer; border: none; background: #d62728; color: white; border-radius: 4px; font-weight: bold; flex: 1; min-width: 120px; max-width: 180px;">Student-t (x=34)</button>
   </div>
</div>
</div>
<style>
.k-day {
    width: 12px;
    height: 12px;
    background: #e0e0e0;
    border-radius: 2px;
    transition: all 0.3s ease-in-out;
}
.k-day.fail {
    background: #d62728;
    transform: scale(1.2);
    box-shadow: 0 0 3px #d62728;
}
.k-day.safe {
    background: #4caf50;
}
</style>
<script src="/js/kupiec-animation.js?v=2"></script>

## 4. Giải mã: Nghịch lý "Vai mỏng" của phân phối Student-t

Nhìn vào kết quả mô phỏng ở phần 3, một câu hỏi lớn được đặt ra: **Tại sao Student-t, một phân phối "đuôi dày" vốn được kỳ vọng sẽ bảo vệ danh mục tốt hơn trong khủng hoảng, lại có tỷ lệ thất bại (34 ngày) cao hơn hẳn phân phối Chuẩn (27 ngày) và bị bác bỏ thảm hại ở VaR 95%?**

Lý do hoàn toàn nằm ở đặc tính toán học của phân phối Student-t:
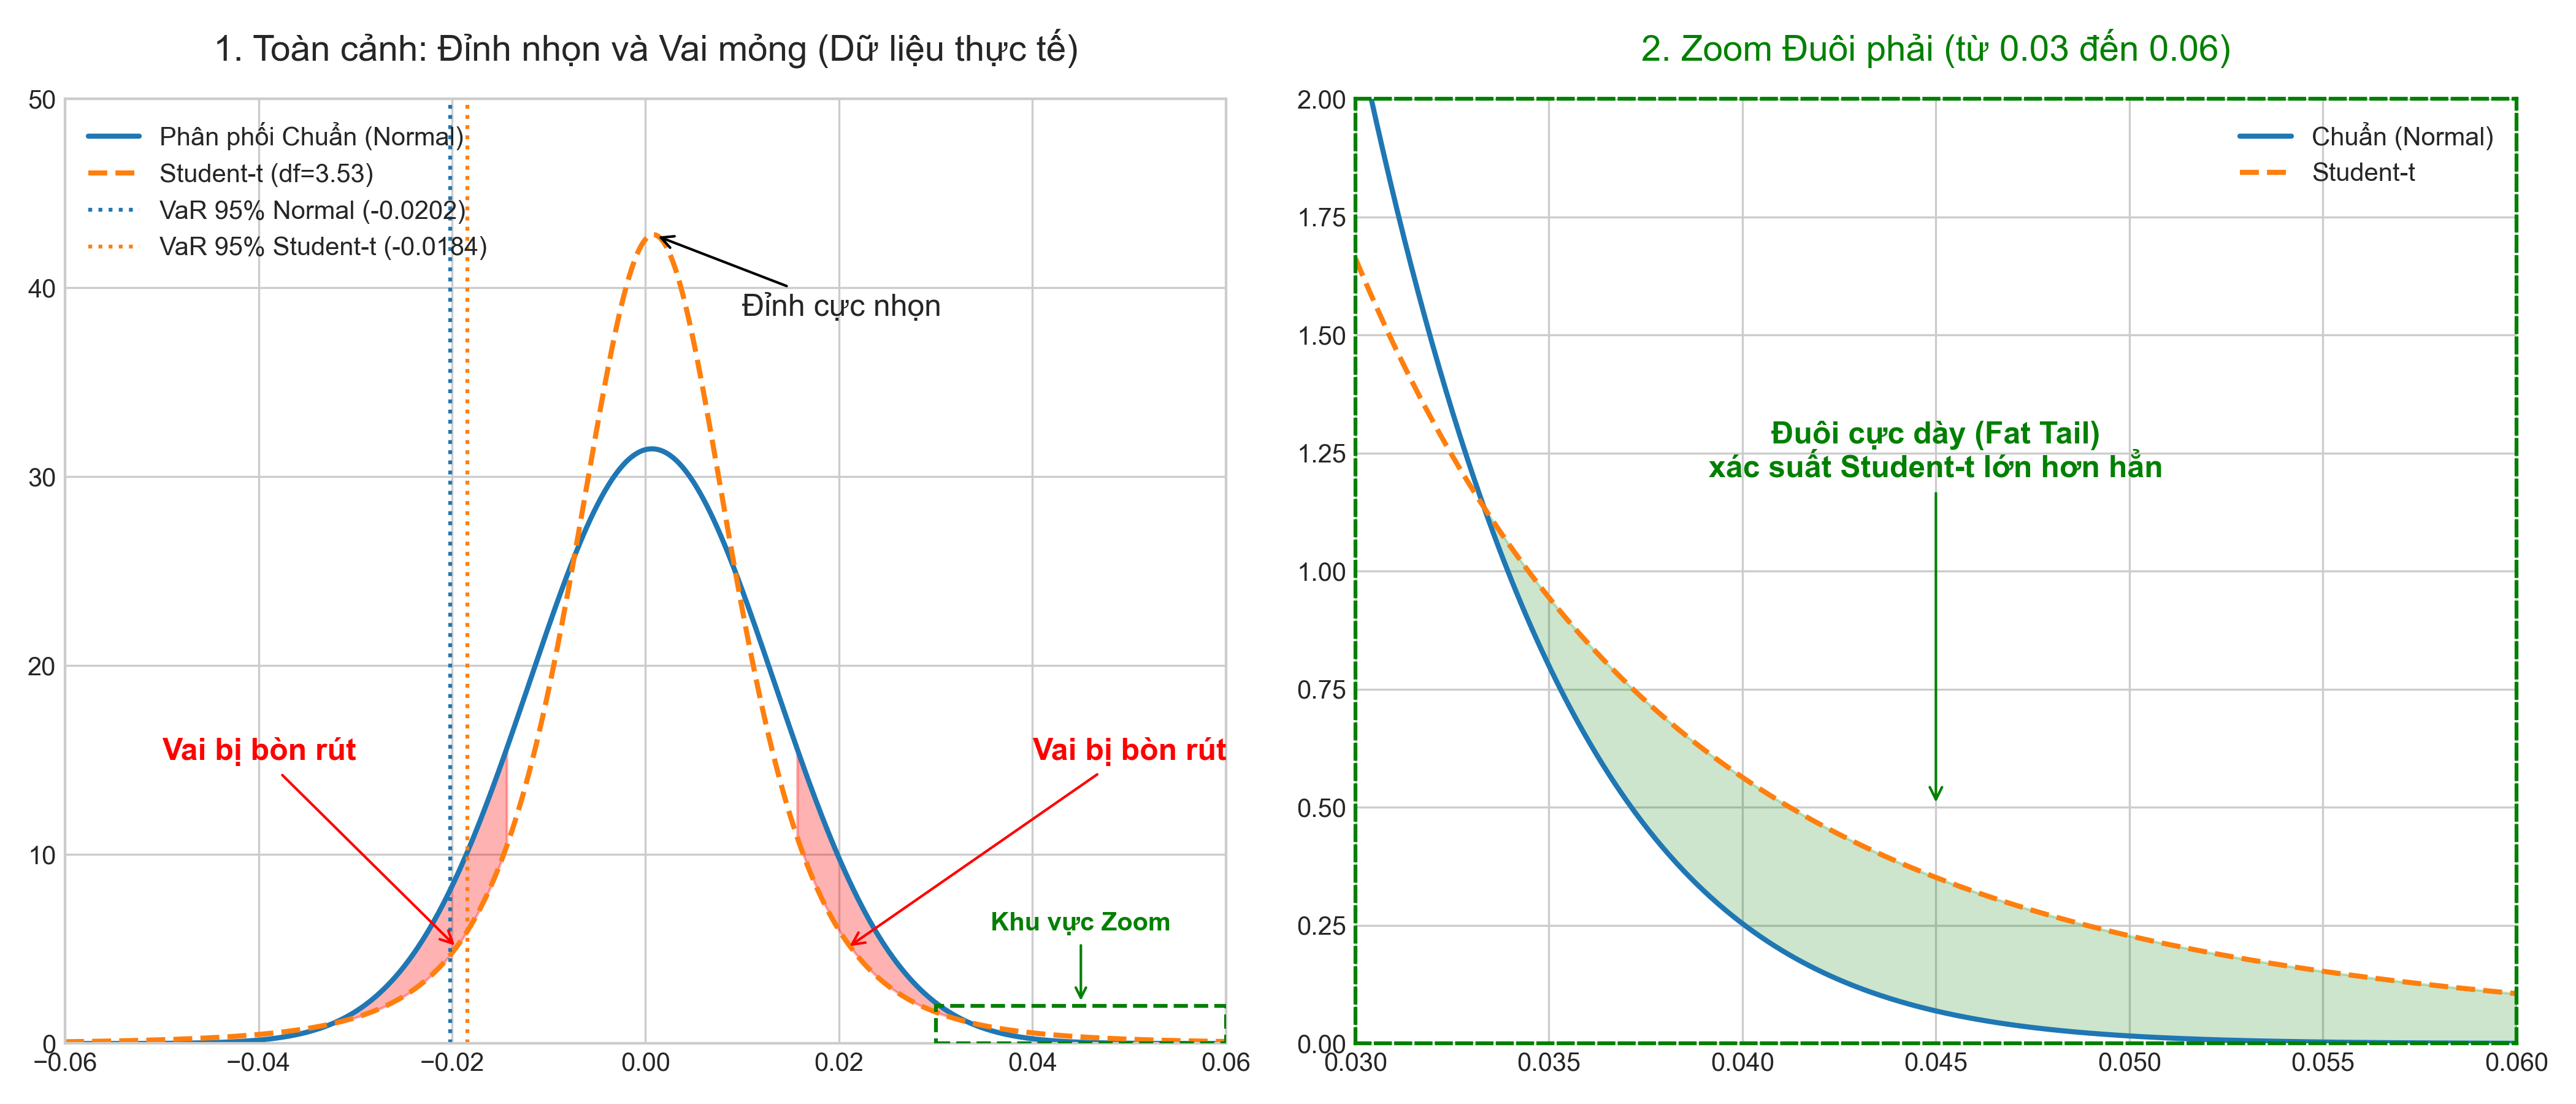
- Để duy trì cùng một mức độ biến động (phương sai) như phân phối Chuẩn, nếu Student-t muốn đẩy một lượng khối lượng xác suất ra xa để tạo "đuôi cực dày" (xử lý vùng cực đoan < 1%) và một "đỉnh cực nhọn", nó bắt buộc phải **bòn rút xác suất từ phần "vai"** (vùng trung gian xoay quanh phân vị 5%).
- Do phần "vai bị mỏng đi", ngưỡng rủi ro VaR 95% của Student-t thực chất lại nằm **thấp hơn (gần giá trị trung bình hơn)** so với phân phối Chuẩn.
- Hệ quả là: Ngưỡng bảo vệ VaR 95% của Student-t quá dễ dãi, liên tục bị các mức lỗ trung bình đâm xuyên qua, dẫn đến thất bại trong kiểm định Kupiec.

*(Lưu ý: Nghịch lý này biến mất khi ta đánh giá ở độ tin cậy 99%. Lúc này phần đuôi dày mới thực sự phát huy tác dụng, đẩy VaR của Student-t vươn xa hơn và an toàn hơn Normal).*

<div class="interactive-pane">
<div style="text-align: center; margin: 20px 0;">
  <img src="/img/thin-shoulder-paradox.png" alt="Nghịch lý vai mỏng của phân phối Student-t" style="max-width: 100%; border-radius: 8px; box-shadow: 0 4px 10px rgba(0,0,0,0.1);">
  <p style="font-size: 0.9em; color: #555;"><i>Hình ảnh so sánh sự phân bổ xác suất giữa phân phối Chuẩn và Student-t (đã chuẩn hóa cùng phương sai). Lưu ý vùng màu đỏ là "phần vai" bị bòn rút.</i></p>
</div>
</div>

### Công cụ Tương tác: Kiểm chứng Nghịch lý
Dưới đây là một mô phỏng tương tác Scatter Plot. Hãy thử chuyển đổi giữa ngưỡng VaR **95%** và **99%** để quan sát vị thế giữa hai đường ranh giới của mô hình Chuẩn (Xanh dương) và Student-t (Cam). Tại mốc 95%, đường màu Cam nằm thấp hơn và bị các chấm đỏ đâm thủng nhiều hơn rất nhiều!

<div class="interactive-pane">
<div style="margin: 20px 0; padding: 15px; border: 1px solid #ddd; border-radius: 8px; background-color: #f9f9f9;">
  
  <div style="display: flex; gap: 15px; align-items: center; margin-bottom: 15px;">
    <div style="flex: 1;">
      <label for="backtest-conf"><strong>Độ tin cậy VaR:</strong></label>
      <select id="backtest-conf" style="width: 100%; padding: 5px; margin-top: 5px;">
        <option value="95">VaR 95% (Kỳ vọng 50 lần vi phạm trên 1000 ngày)</option>
        <option value="99">VaR 99% (Kỳ vọng 10 lần vi phạm trên 1000 ngày)</option>
      </select>
    </div>
  </div>
  
  <div style="display: flex; gap: 15px; margin-bottom: 15px;">
    <!-- Bảng Normal -->
    <div id="stat-normal" style="flex: 1; padding: 10px; background: #e7f1ff; border-left: 4px solid #1f77b4; border-radius: 4px;">
      <strong style="color: #1f77b4;">Mô hình Chuẩn (Normal)</strong><br>
      Số lần vi phạm: <span id="val-normal-count" style="font-size: 1.2em; font-weight: bold;">--</span><br>
      Kupiec Test: <span id="val-normal-res" style="font-weight: bold;">--</span>
    </div>
    <!-- Bảng Student-t -->
    <div id="stat-student" style="flex: 1; padding: 10px; background: #fff3cd; border-left: 4px solid #ff7f0e; border-radius: 4px;">
      <strong style="color: #ff7f0e;">Mô hình Student-t (df=3)</strong><br>
      Số lần vi phạm: <span id="val-student-count" style="font-size: 1.2em; font-weight: bold;">--</span><br>
      Kupiec Test: <span id="val-student-res" style="font-weight: bold;">--</span>
    </div>
  </div>

  <!-- Đồ thị trực quan -->
  <div id="backtest-scatter-plot" style="width: 100%; height: 400px; border: 1px solid #ccc; border-radius: 4px; background: white;"></div>

</div>
<script src="https://cdn.plot.ly/plotly-2.32.0.min.js"></script>
<script src="/js/kupiec-backtest-interactive.js"></script>
</div>

## 5. Hạn chế của POF và Điều kiện Đủ của Backtesting

Kiểm định Kupiec POF là **điều kiện CẦN** nhưng chưa đủ để đánh giá toàn diện một mô hình rủi ro.

- **Phạt cả hai phía:** Kupiec POF là một kiểm định hai đuôi (two-tailed). Nó bác bỏ mô hình khi số thất bại quá nhiều (đánh giá thấp rủi ro), và cũng bác bỏ khi số thất bại quá ít (mô hình quá bảo thủ, bắt ngân hàng đọng quá nhiều vốn dự trữ).
- **Mù tịt trước "độ sâu" của cú sập:** Kupiec chỉ đếm "tần suất" vi phạm. Nếu danh mục lỗ vượt ngưỡng 1 triệu hay 100 tỷ thì Kupiec cũng chỉ ghi nhận là "1 lần vi phạm". Để đo lường độ sâu, ta phải **Backtest Expected Shortfall (ES)**. Tuy nhiên, ES không có tính chất *Elicitability* trực tiếp như VaR, khiến việc backtest nó phức tạp hơn nhiều.
- **Bỏ qua Tính độc lập (Hiện tượng Volatility Clustering):** Điểm mù lớn nhất của Kupiec POF là không quan tâm đến *thời điểm* xảy ra thất bại. Nếu 5 thất bại xảy ra liên tiếp trong 5 ngày, rủi ro sụp đổ hệ thống cao hơn rất nhiều so với việc 5 thất bại rải đều trong 100 ngày. Để khắc phục, Christoffersen (1998) đã đề xuất thêm **kiểm định Tính độc lập (Independence test)** (đóng vai trò là Điều kiện Cần thứ 2) để đảm bảo các vi phạm không bị co cụm.

